

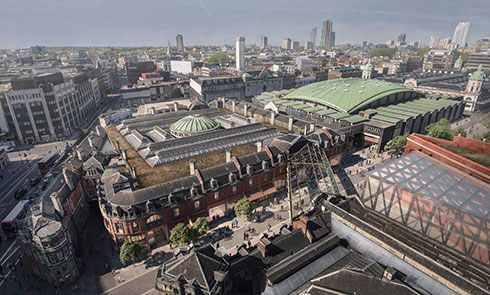


Pulse, a new installation at the Museum of London, tracks social media live to see what Londoners are thinking and tweeting about. Ever wondered whether people online liked London or which emoji was most popular in your borough?
Our City Now City Future season is all about life in cities around the world. We want to understand how Londoners feel about their city, and look at what people are doing to improve the urban environment. So we've commissioned data visualisation studio Tekja to create Pulse, a live, digital portrait of the words, emotions and even emojis.
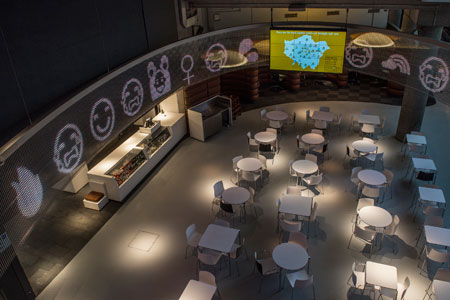
Emojis displayed in the Pulse installation
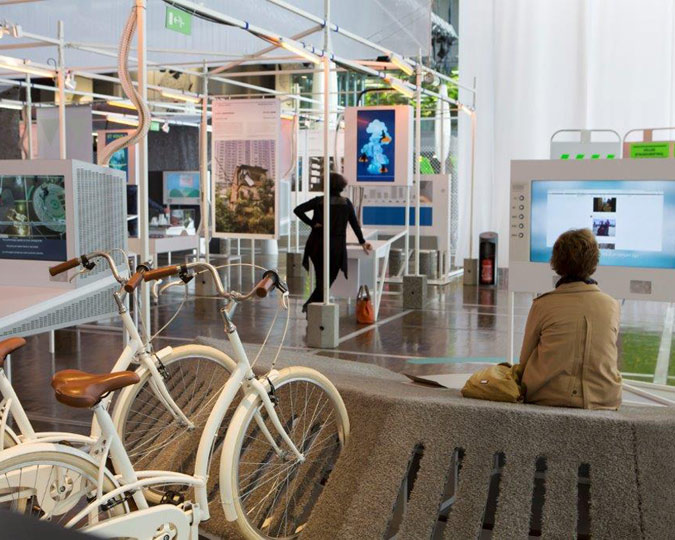
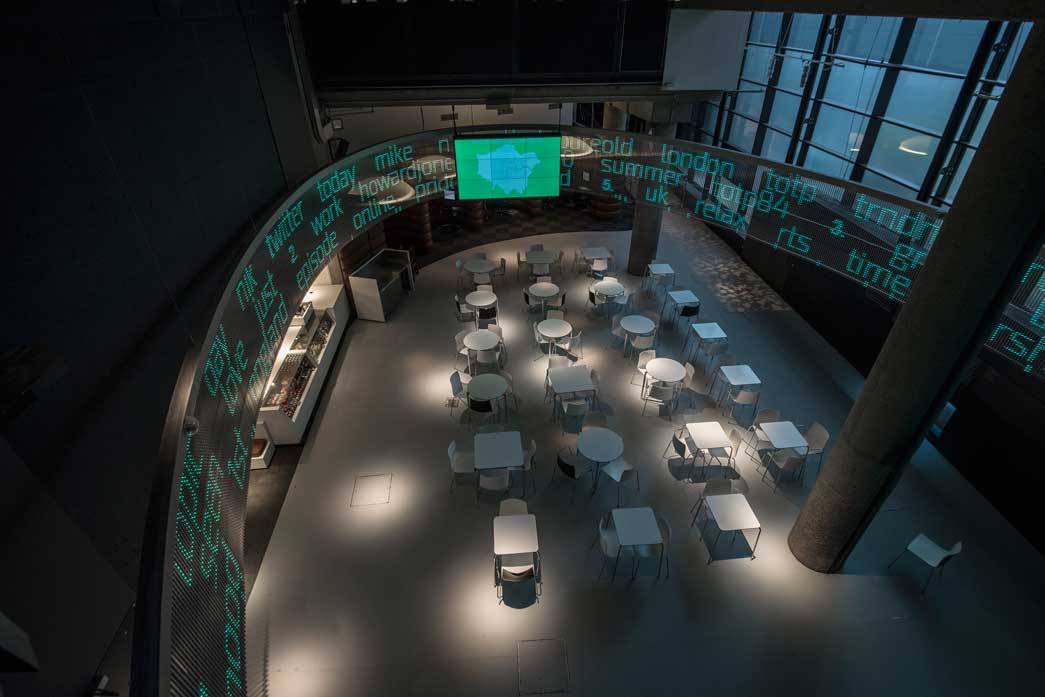
In the Museum of London's Sackler Hall
Pulse collects, analyses and displays tweets in the Greater London area in real time. Pulse will run 24/7 for 9 months, until April 2018, telling the stories of Londoners through an estimated 17 million tweets. Considering that on average people in London use 12 words per tweet, that will be around 210 million words, and a total of 8 million emojis.
Pulse only picks up geotagged tweets- posts sent with a location, so that we can be sure they come from within London. On an average day, in Greater London there are 65,000 geotagged tweets, with a frequency of 1 tweet per second during the day and a little less during the night. On an extraordinary day, for example the day after the general election 2017, the total tops 95,000 geotagged tweets.
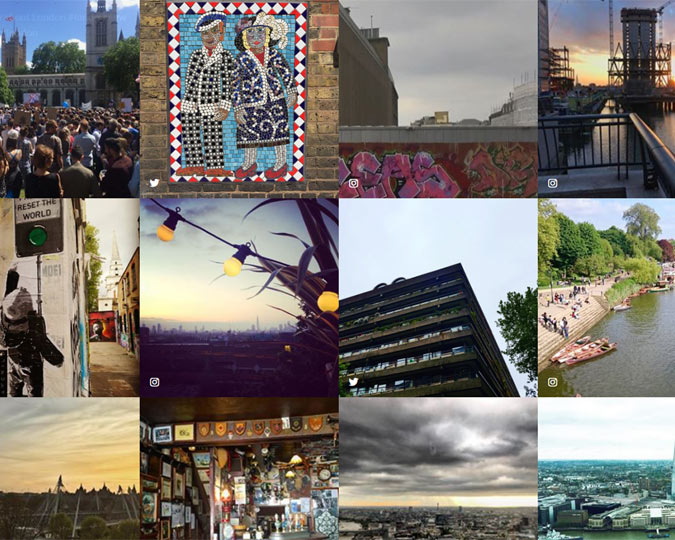
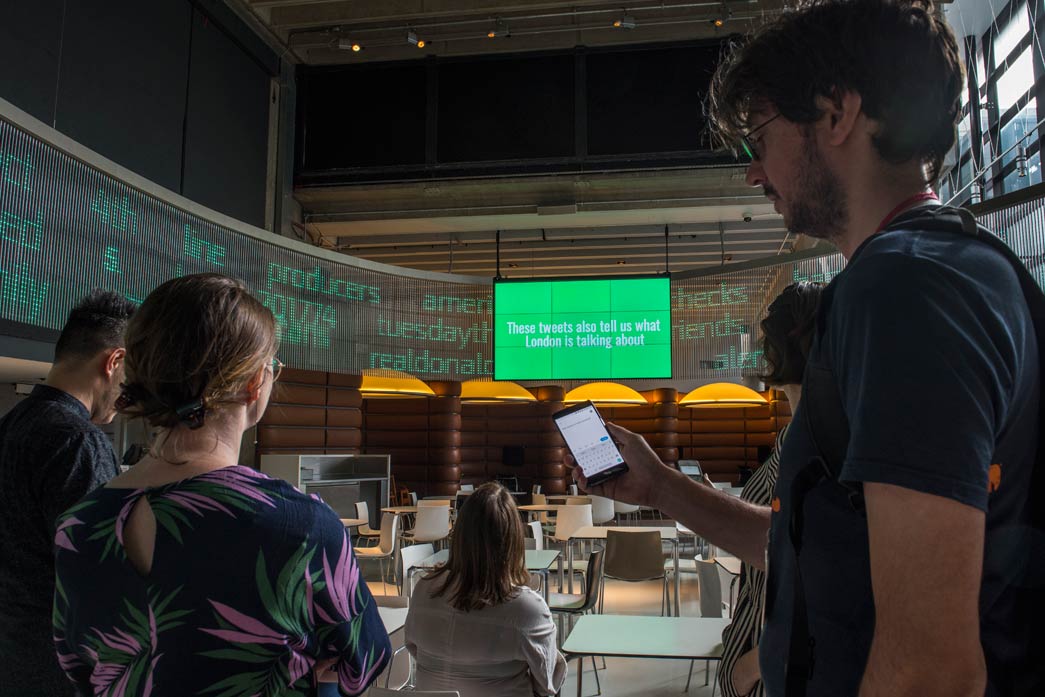
Pulse runs in real time, which means that it takes a fraction of a second for a tweet to show up in our galleries once it’s posted. If you tweet from inside our free The City is Ours exhibition, you'll be able to see your own message appear in Pulse and be incorporated into the data on display. Pulse shows tweets as raw data on an LED 'curtain' and performs real-time analysis of the data on the attached screen.
Amanda Taylor, co-founder of Tekja and one of the brains behind Pulse, explained why it's perfect to help us understand the city:
"Our world is becoming increasingly data-driven and London plays a huge role in this global digital landscape - producing a vast volume of real-time data every second of every day. Pulse takes one source of real-time data from London – Twitter - and collects, analyses and visualises these live streams, tracking the digital ‘heartbeat’ of the city by exploring changing patterns, trends and reactions in the city in real-time.”
Dramatic events on display
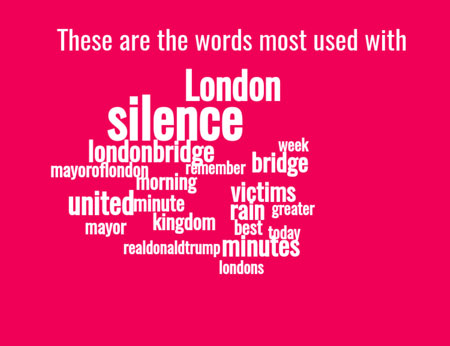
Tweets from London Bridge
Words most strongly associated with London on social media on 6 June 2017.
Pulse automatically tracks hot topics in London's Twitter posts, assessing the words and emotions most strongly associated with those subjects. Pulse is continuously connected to the Twitter API, which provides the top trending topics in London. Trending topics refer to breaking news or topics that draw particular bursts of hashtags.
Pulse can therefore look at the current trending topics and pull out key words and expressive emojis from the live tweets that relate to that subject.
The key topics of June 2017 were: #GE17 with a spike of
Happy capital?
Pulse also performs sentiment analysis on the messages it picks up. Sentiment analysis involves the analysis of text to detect and quantify emotional states.
Every tweet is run through natural language processing and machine learning algorithms. An automatic classifier determines if the tweet is positive, negative or neutral, based on a model trained on historical tweets labelled by human analysts.
On an average day, Pulse detects around 34% positive, 17% negative and 49% neutral tweets.
Election
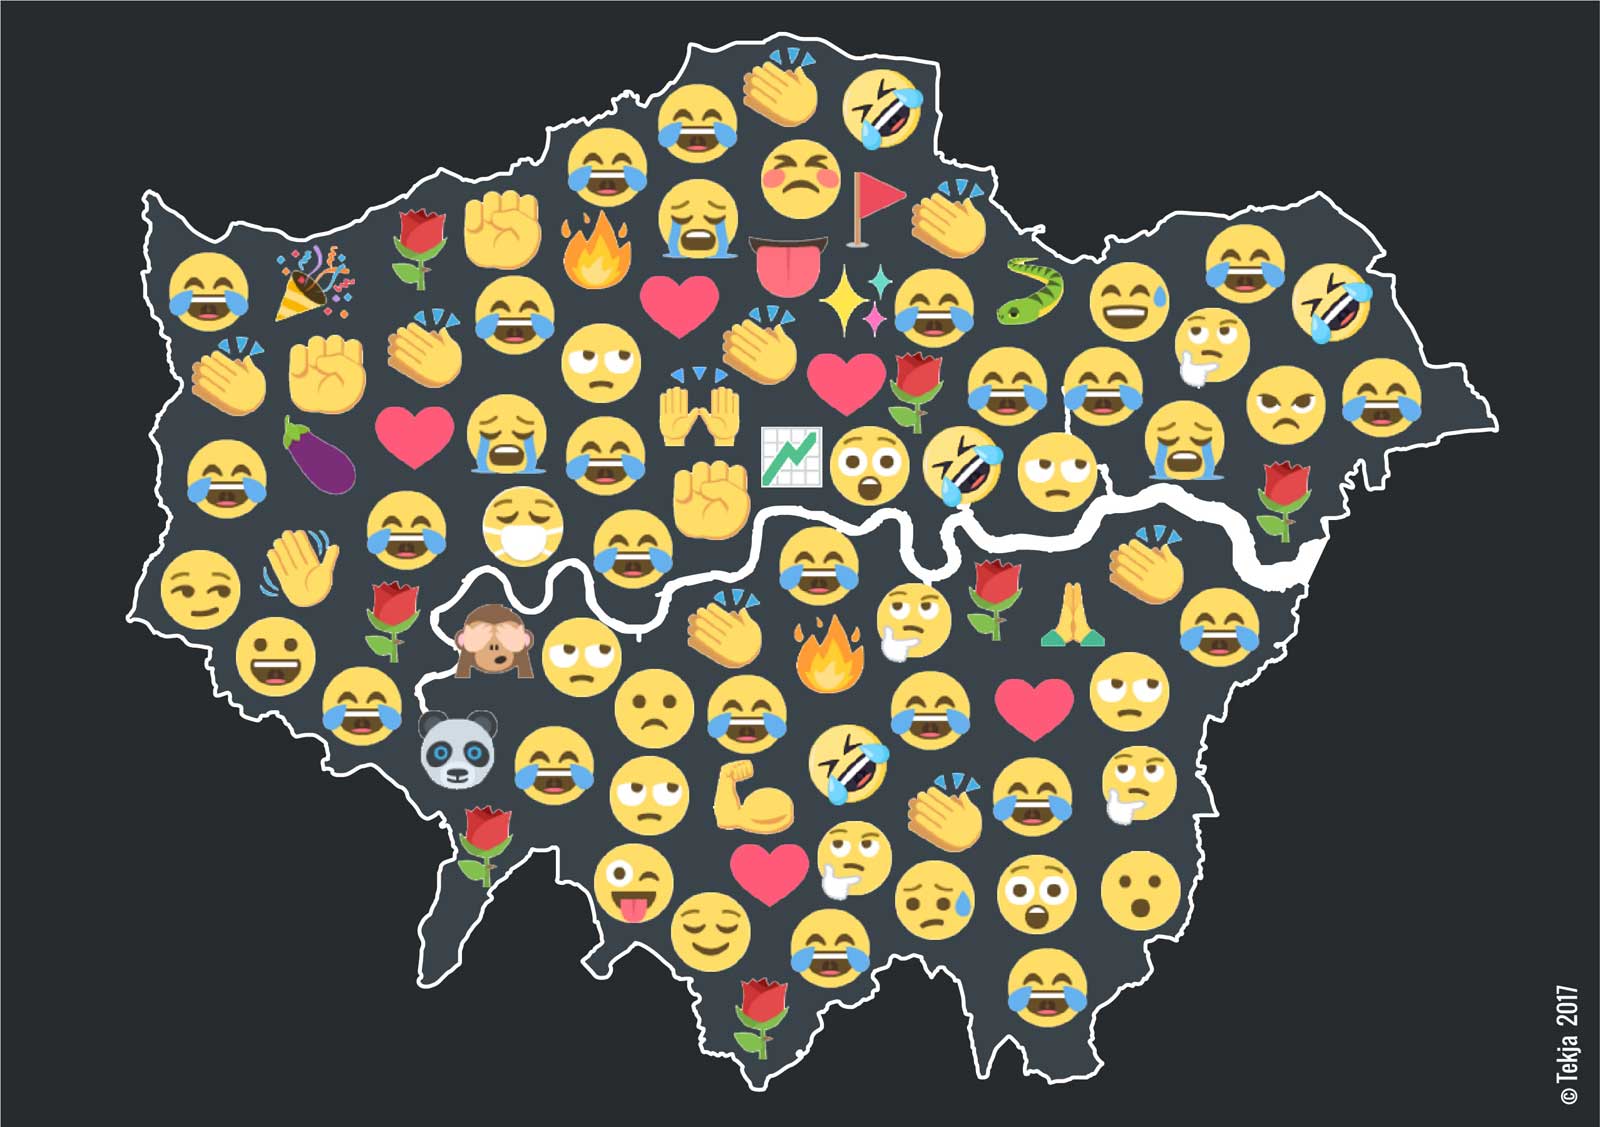
Pulse picks up all the emojis in the tweets and aggregates them by geography, showing the most popular emoji for each borough and by topic, showing what emojis relate to the current trending topics. On average, there is one emoji every two tweets. This means that every day, in the geotagged tweets in London, there are around 30,000 emojis.
The most used emojis in London are:
We are tracking the evolution of Twitter activity over time, which means we can spot changing patterns and trends such as in key moments like the announcement of the snap election (16 April), the days just before the election day and election day (6-7-8 June) and the aftermath (9-10 June). This is what we found:
- At least one person in five on Twitter were talking about the election in the immediate aftermath.
- The volume of mentions of words linked to the Conservative party grew from 2.5% of overall traffic on the announcement day, to 3.7% on the days before the election, to 8.1% on the days after the election
- The volume of mentions of words linked to the Labour party grew from 1.8% of overall traffic on the announcement day, from 4.8% on the days before the election, to 6.5% on the days after the election
- Compared to ‘labour’ words, words related to the Conservative party were more talked about on the announcement day and just after the election, whilst words related to the Labour party had a stronger share of traffic on the election day / just before the election.A major change in mentions was detected (200% gain) on tweets containing the word ‘Theresa’ just after the election. The sentiment around ‘Theresa May’ was of 5% more negative after the election (26% positive, 35% negative and 39% neutral tweets) when compared to before (27% positive, 30% negative and 43% neutral tweets).