


In this section


Old age in the city and the countryside
So, did living in the city with all its improvements during the industrial period increase your chances of living into old age?
Or did communities in the countryside consist of more older people as they seem to today? When did people start living longer?
From the later medieval period and into the industrial period, we start to see documentary records being kept that charted the number of deaths in the city. Importantly, some of these records contain the age of the deceased. The Bills of Mortality were weekly statistics for recording burials in some of the London parishes. Although not necessarily completely accurate, they allow us to start thinking about age as a population demographic and to examine if life expectancy has changed over time.
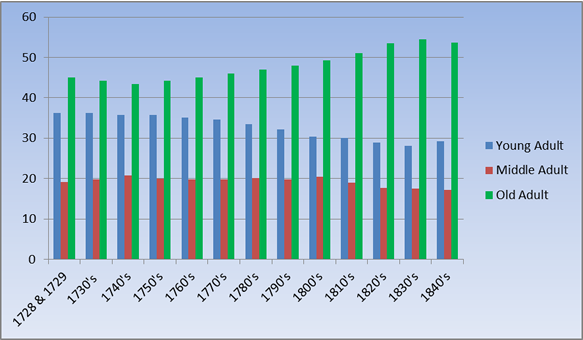
Charlotte Roberts and Margaret Cox undertook analysis of the Bills of Mortality and found that people were starting to live longer between 1728 and 1850, meaning that London’s population was starting to age. Our analysis shows that in 1728, 45% of the population was aged over 50 years old, and that this rose to 53.7% of the population by 1850.
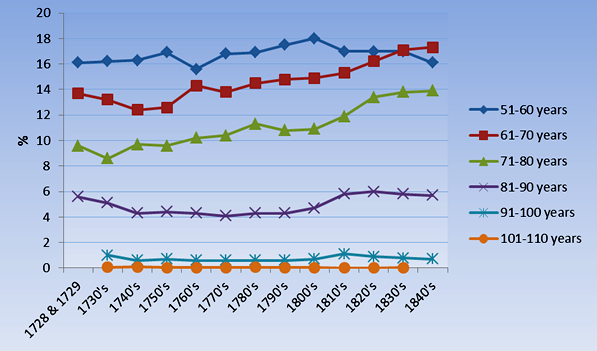
Looking more closely at the data, the age profile of the old age group itself was changing. Fewer older adults were dying in their 50’s and more people were living into their 60s and 70s, and even 80s.
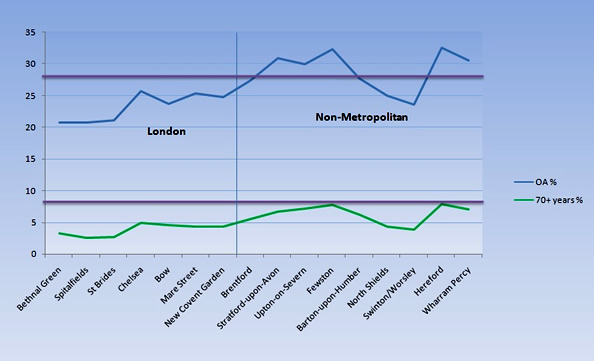
Census data from a later period between 1851-1860 indicates, however, that communities living in small rural towns and villages consisted of more elderly people compared to London. However, the populations of larger towns and suburbs outside of London, such as Barton-upon-Humber, North Shields and Swinton, also had lower numbers of elderly residents like the city. Urbanisation in any location de-ages populations.
In part, this was due to the effect of the ‘greying of the countryside’ caused by the migration of younger generations out of rural areas into urban centres to look for work and to live with modern conveniences. Cities like London have a different age demographic and their populations are younger. In 2011, only 10% of households in London included pensioners compared to 22% in other areas of England.
The fact that there were still relatively few people living into their late 70s and 80s is reflected by the lack of hip fractures we saw in our skeletal populations. Although the number of hip fractures did increase over time as populations started to get older, they are much more common today because the average age of hip fracture with underlying osteoporosis is 77 years and the risk of hip fracture is much higher in 80+ year olds at 25%.
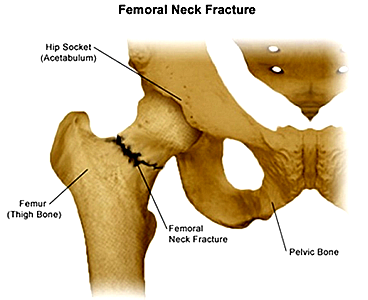
Femoral neck fracture (© Stanford Health Care, https://stanfordhealthcare.org/medical-conditions/bones-joints-and-muscles/hip-fracture/types.html)
The hip fractures we found in London occurred most frequently in low status groups, perhaps because of the more hazardous nature of these living environments. A lack of social support for the elderly within working families may also have increased the risk of hip fracture for the elderly in low status groups. When people suffered age-related conditions that stopped them from being self-sufficient, who could they rely on for help? How did the elderly get by and how does this compare to now?